A$1.175m decimal equivalent; ~A$22.7m in 2023 purchasing power.

THE PUBLIC BILL / RESEARCH & COMMUNITY
The cost
of the Games.
Three Australian Olympics. Public money, lasting assets, and a bill that is harder to pin down than a headline suggests.
Based on the supplied research report, evidence to 1 October 2026. Historical costs are recorded outcomes; Brisbane figures are commitments and forecasts.
Read the full report ↗ Have your say ↓Start with the scope.
A state contribution, a net budget cost and a whole venue program measure different things. The report does not establish a single state “Olympic debt payoff” date for any of these Games. Closing the organiser’s accounts is different from repaying general government debt.
THE NUMBERS AT A GLANCE
A graph with the differences left in.
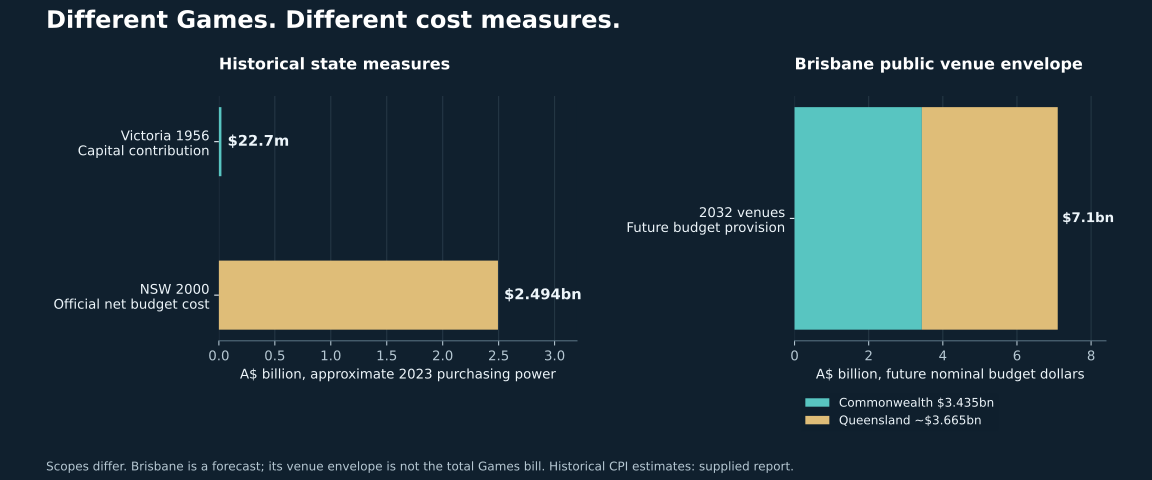
| Games | State measure | Published / nominal | Approx. 2023 value |
|---|---|---|---|
| Melbourne 1956 | Victoria capital contribution | £587,500 / A$1.175m decimal equivalent | A$22.7m |
| Sydney 2000 | NSW official net budget cost | A$1.3261bn | A$2.494bn |
| Brisbane 2032 | Inferred Queensland venue share | ~A$3.665bn future provision | Not yet calculable precisely |
1956
MELBOURNE / HISTORICAL RECORD
A modest capital fund.
An incomplete total.
A$4.739m decimal equivalent; ~A$91.4m in 2023 purchasing power.
Who funded it?
Victoria and Melbourne City Council each contributed £587,500. The Commonwealth contributed £1.175m. Those contributions totalled £2.35m; actual capital-fund spending reached £2.369m.
What is missing?
This capital fund does not consolidate all public transport, security and departmental operating costs. It should not be described as the complete public bill.
When was it paid off?
Victoria’s share was financed through four Loan Acts. No Games-specific state amortisation schedule was established. A separate guaranteed organiser overdraft still had £24,655 outstanding in June 1958, around 19 months after the Games.
Report pp. 5–7; Victorian Auditor-General, 1958 ↓
Follow the money.
2000
SYDNEY / AUDITED BUDGET IMPACT
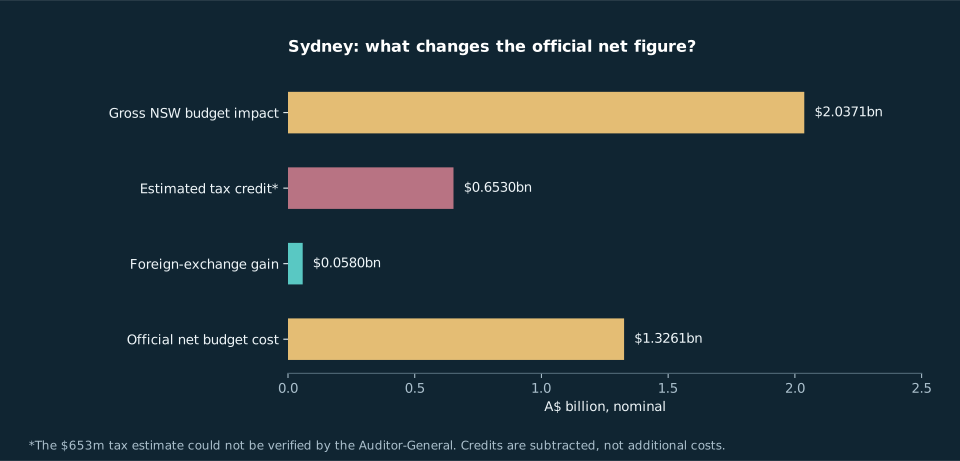
The tax offset
changes the headline.
Approximately A$2.494bn in 2023 dollars.
Approximately A$3.831bn in 2023 dollars.
Public, organiser and private funding combined — not the NSW taxpayer bill.
The qualified audit
The official net figure deducts an estimated A$653m in extra state tax revenue and an A$58m foreign-exchange gain. The Auditor-General could not verify the tax estimate; that does not establish it was wrong. Without that credit, retaining the exchange gain, the implied burden is A$1.9791bn.
Costs outside the net figure
A$101.8m of redeployed public-servant salaries and estimated future venue maintenance of A$11m a year were outside the official net budget calculation.
Closure is not debt repayment
The organiser’s A$59.8m deficit was met by the state. SOCOG dissolved on 31 October 2001; budget reconciliation ran to March 2002. Neither date is a documented payoff date for a separate NSW Olympic debt.
Report pp. 7–10; NSW Auditor-General, 2002 ↓
2032
BRISBANE / FUTURE COMMITMENTS
A venue budget.
A wider bill still to come.
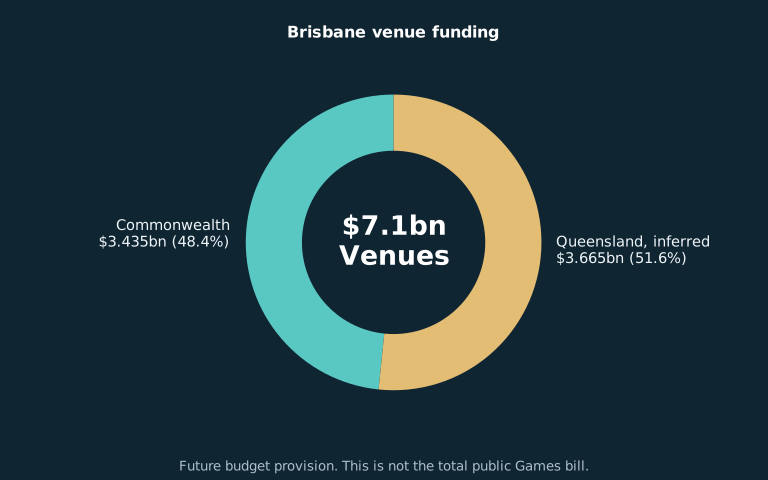
Commonwealth A$3.435bn; inferred Queensland balance ~A$3.665bn.
State venue share plus A$407.5m of selected separate measures. Not a final forecast.
Selected additional state measures
- A$250m: Games On! grassroots legacy program.
- A$101.9m: four-year government Games responsibilities.
- A$55.6m: Games Office allocation.
The report adds these to the inferred venue share to calculate its narrow Queensland lower bound.
Do not add these as a simple total
The A$3.5bn village program involves private participation. The Commonwealth’s A$12.4bn transport investment also serves long-term transport needs. Their Olympic-only public shares are uncertain, and program allocations can overlap.
Still unknown
Final security and operations costs, later agency spending, the public village share, transport attribution, ongoing venue maintenance and any organiser shortfall.
No state payoff year
The report cites an organiser QTC borrowing balance of A$14.7m in June 2026 and expected repayment starting during or after FY2029–30. That is working-capital borrowing, not a repayment schedule for Queensland’s venue investment. These organiser figures are attributed to the report’s September 2026 reporting.
Report pp. 10–13; Venue funding agreement ↓; Queensland Budget 2025–26 ↓.
SECOND REPORT / LOCAL REVENUES & PAYBACK
Who earns the money?
Who carries the bill?
Visitor spending, local business sales, organiser receipts and government revenue are different streams. A hotel earning more does not automatically give a council money to repay a venue.
Melbourne: a narrower reconstruction
The new report cites an approximately £850,000 core sporting-works estimate: £300,000 for the MCG, £350,000 for the swimming stadium and £200,000 for other works. It separately discusses roughly £2m in Commonwealth housing finance for the Heidelberg Village, which became public housing.
That estimate is a different scope and accounting stage from the first report’s actual £2.369m capital-fund spending. It does not replace the audited contribution figures above. The minor-venue allocations are reconstructions, not historical expenditure ledgers.
Sydney: receipts are not verified repayment
The second report compares the $653m estimated tax uplift with a narrow construction-cost range and suggests roughly 50% recovery. The NSW Auditor-General could not verify the tax uplift. We therefore do not present that ratio as proven recovery or a debt repayment date.
Brisbane: public cash versus economic activity
The report maps venues and legacy assets across Brisbane, the Gold Coast, Moreton Bay, the Sunshine Coast, Redlands and regional Queensland. Its local economic-activity ranges and allocated operating costs are models, not audited council revenue.
It also tests a $7.165bn combined venue-plus-village provision. The villages involve private participation and retained or saleable assets; this combined provision is neither a confirmed net state burden nor a net Olympic loss.
Why legacy matters
Venue earnings, additional taxes, rates and fees may contribute to public cash returns. Housing, transport access, sport and retained asset value can have benefits beyond cash payback. Those benefits should be assessed separately rather than counted twice.
EXPLORE THE ASSUMPTIONS / NOT A FORECAST
What would payback require?
The second report uses a 4% real discount rate. At that rate, recovering the $3.665bn Queensland venue share over 30 years requires about $212m a year in sustained net additional public cash. The illustrative $7.165bn combined provision requires about $414m a year.
| Net public cash each year | Simple payback | Discounted payback at 4% real |
|---|---|---|
| $50m | ~73 years | No finite payback |
| $100m | ~37 years | No finite payback |
| $150m | ~24 years | ~97 years |
| $212m | ~17 years | ~30 years |
| $250m | ~15 years | ~23 years |
| $300m | ~12 years | ~17 years |
Try a different annual return
Teal: cumulative discounted cash. Gold: investment to recover.
Illustration only: one upfront investment, fixed annual net returns paid at each year-end, constant real discount rate, no asset sales or terminal value. Annual returns must be additional to what would happen without the Games and net of ongoing costs. Actual construction cash flows and future receipts are unknown. Cash payback is not a measure of every social or economic benefit.
THE EVIDENCE / EXPLAINED HERE
The key source information,
without leaving the page.
What the Sydney audit actually says
The 2002 audit accepts the net budget calculation apart from its unverifiable tax estimate. It distinguishes extra budget payments from the wider resources used by government. Existing staff time and future maintenance can matter even when they sit outside the net budget figure. No single cost measure covers every purpose.
What the funding agreement covers
The July 2025 agreement assigns $3.435bn of Commonwealth funding to the $7.1bn venue program for 17 new or upgraded venues. The $12.4bn transport figure refers to projects with both Games and long-term transport purposes. It is not an extra Olympic-only consumption bill.
What is promised for the stadium
GIICA describes Victoria Park as the planned stadium site, with 63,000 seats and concert capacity up to 70,000. Its proposed Games role includes ceremonies and athletics; the legacy plan includes AFL, cricket and concerts. Capacity and planned uses do not establish future profits or payback.
Why delivery risk matters
The Queensland Audit Office’s Major projects 2025 report identifies workforce shortages, early planning and competition for labour as delivery risks. Its venue-planning snapshot is dated June 2025. Those risks explain why estimates need review; they do not prove a particular future overrun.
Our summaries use original wording. Source dates and links are listed in the references below; later developments may change plans. The full research PDFs remain available on this site.
MEET CASEY / GAMES GUIDE
Ask about the figures.
Casey is our automated team guide. Tick “Ask Casey” when you post a comment to request a research-based reply. Team replies are labelled; they are not independent public votes. Answers may take a few seconds and can be unavailable when the service is busy.
Join the Games Cost Room ↗ Ask in the comments ↓COLIN’S VIEW / OPINION
In my view, Brisbane should not host the Olympic Games.
The cost commitments and unresolved public bill are central to that view. Others point to the sporting, housing and transport assets the Games may leave behind. The figures help frame the argument; they do not settle whether the Games are worth hosting.
COMMUNITY DISCUSSION
What do you think?
Members and guests can comment. No account is required. Choose the display name you want shown publicly; a display name does not verify someone’s identity.
Recent comments
Loading comments…
Read the evidence
Olympic Games Costs, Local Revenues and Payback — second full report ↗
The report contains the source list, methods, CPI assumptions and fuller breakdowns. This page is a summary. Sydney’s historical CPI conversion uses calendar 2000 as an approximation for spending across 1993–2002. No forecast is presented as a final total.
Original sources & credits
Optional links to check the originals. The explanations, graphs, reports and discussion are above on our site.
- Victorian Auditor-General, 1958 ↗
- NSW Auditor-General, 2002 ↗
- Venue funding agreement ↗
- Queensland Budget 2025–26 ↗